
BESS Software Comparison
Co-Location Modelling: Solution Comparison
Generic models miss the physics. Spreadsheets break under complexity. Here is what to look for — and how Catalyst compares.
Stuck in Models and Unclear Decisions
100%
Time spent in modelling
Without Catalyst — spreadsheets, manual revenue-stacking, chasing market data
Clear Decision, Smooth Projects
-70%
Time spent in modelling
With Catalyst — sizing, dispatch, and outputs handled for you
Software that lets you focus on what matters: getting projects built.
Teams that switch from maintaining their own models to Catalyst get most of that time back — time that goes straight into moving the project forward: securing the site, negotiating the grid connection, closing financing.
Results achieved by Catalyst
133%
market capture rate at the optimal PV+wind+BESS mix — Maxsolar
9.35%
IRR at optimal storage sizing — Greentech
8.5–13.9%
IRR range across 5 scenarios, all clearing the hurdle — Fluence
The Landscape
How teams model BESS and Co-Location economics today.
The default starting point for most teams — a flexible, zero-cost way to sketch a first revenue estimate.
Strengths
- +No licence cost
- +Fully customisable
- +Easy to share
Limitations
- –No physics-based degradation — flat percentage assumptions only
- –Revenue stacking across FCR, aFRR, and arbitrage is manual and error-prone
- –No market data integration — assumptions go stale immediately
- –Audit trail is non-existent — lenders cannot verify assumptions
- –Scenario analysis at scale (50+ configs) is practically impossible
Acceptable for rough screening. Inappropriate for investment-grade analysis or lender due diligence.
Want to use a spreadsheet? Check out our Modelling Tools.
External engineering or energy consultants engaged for a bespoke, one-off techno-economic study.
Strengths
- +Deep domain expertise per engagement
- +No internal tooling investment required
- +Independent, third-party credibility for lenders
Limitations
- –Each engagement is a fresh, largely non-reusable analysis
- –Turnaround measured in weeks, not hours
- –Cost scales linearly with the number of projects screened
- –Results aren't interactively re-run as assumptions change
- –No standing methodology across a growing pipeline
Valuable for a one-off, high-stakes analysis or a second opinion — not a scalable way to screen a growing pipeline.
A proprietary model built and maintained by an internal engineering team.
Strengths
- +Tailored to specific markets and assets
- +No licence dependency
Limitations
- –Typically 6–18 months to build at significant engineering cost
- –Single-team expertise — no continuity if key developers leave
- –Ongoing maintenance burden as markets and regulations evolve
- –Cannot benefit from industry-wide data and methodology improvements
Reasonable for large-scale IPPs with dedicated engineering teams. Prohibitive for most project developers.
- ✓Technically model BESS: real degradation curves, cell chemistry parameters, and ramp-rate limits
- ✓Combine FCR, aFRR, Day-Ahead, and Intraday revenues in one coherent model
- ✓Co-location modelling: Wind + BESS, PV + BESS with EEG constraints
- ✓15-minute market price granularity for DE, AT, CH and expanding EU markets
- ✓Thousands of scenarios simulated at once
- ✓Bankable project finance documentation generated directly from the model
- ✓Calculate thousands of configurations — ranked by NPV, IRR, or CapEx
- ✓All EU markets supported
Catalyst evaluates thousands of project configurations, ranks them by NPV and IRR, and gives investment committees a strategic foundation to say yes — backed by physics-based models and 15-minute market price granularity.
Key Features
Understand and implement every project.
Model and optimize any BESS project. Numbers that hold up in front of the investment committee.
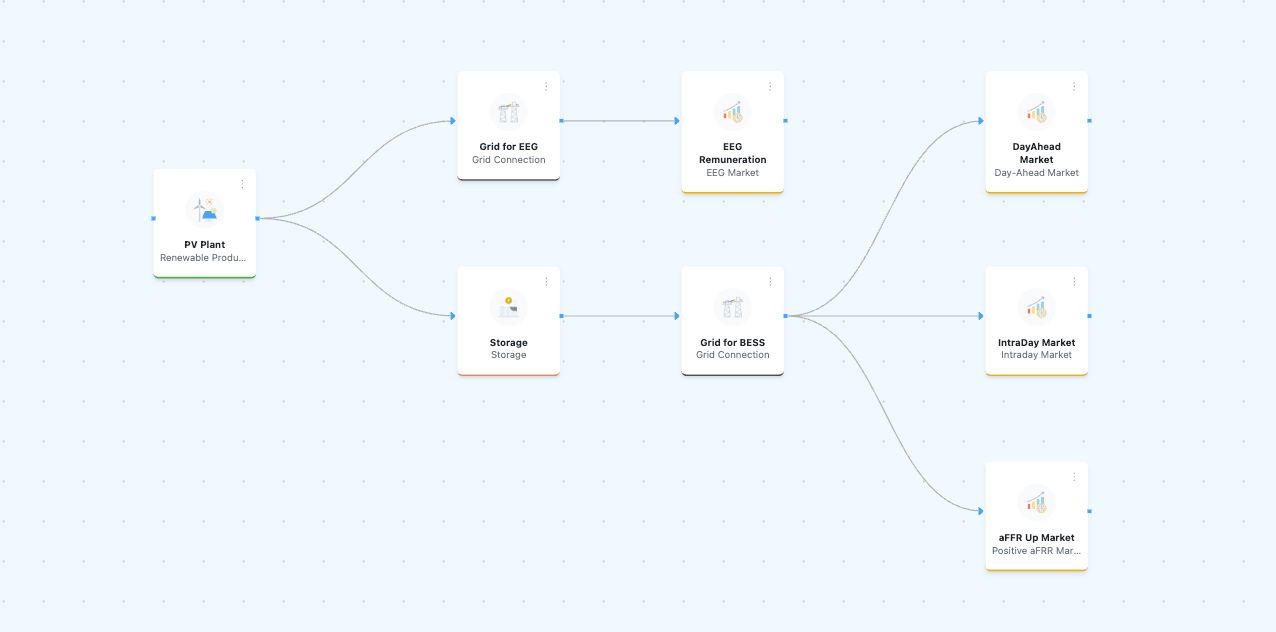
Custom project setup
Configure your wind, solar, or hybrid project in minutes - adapted to your location and target market.
Technically model BESS
Every simulation computes using real degradation curves, cell chemistry parameters, and ramp-rate limits.
Utilize various revenue streams
Combine FCR, aFRR, Day-Ahead, and Intraday revenues in one coherent model.
Explore multiple scenarios
Calculate thousands of parameter combinations and rank results by NPV, IRR, or CapEx.
Start with ready-made templates
Start right away with market-ready project templates for key EU markets.
Quarter-hourly dispatch
Simulate every 15-minute interval with high-resolution price and grid data.
Open for all market price curves
Import your own price data for maximum flexibility - any format, any market, any scenario.
PV and wind feed-in
Supports a variety of generation types and profiles.
No Black-Box AI
Deterministic solver - every result is traceable, auditable, and explainable.
All EU markets supported with high accuracy
Germany, France, Spain, and more - real market designs and local regulations integrated.
Configurations
Exact Results for Every Project Setup
Most Frequently Modelled
Trusted by leading professionals






General-purpose dispatch and trading optimization platforms, often already in use by an operations or trading desk.
Strengths
- +Speeds up the modelling process
- +Reliable outcomes
- +Physics taken into account
Limitations
- –Some software is repurposed from other use cases
- –Some don't allow for 15-minute granularity
- –Not flexible enough to represent the grid connection point
Strong for operating an asset once it's built — not for deciding what to build and how to size it.
Frequently asked questions
Real Customer Stories
More Stories
Sizing storage against the grid connection, not a fixed target
Greentech Energy GmbH · Eastern Germany
A 42-business-case sweep across power and duration found the optimal storage share of a shared grid connection — not the largest system, the most valuable one.
See how Catalyst models your project.
We run a live analysis of your specific site in 30 minutes. No generic demo — your project, your numbers.